Next: Model setting without an Up: Alternative formulation Previous: Alternative formulation Contents Index
Running Simulation - Convergence Monitoring - Residuals
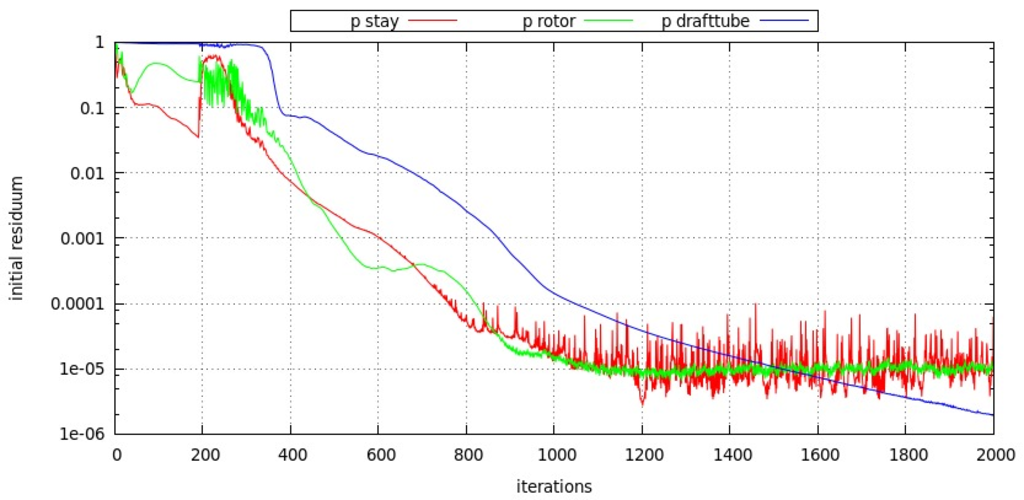
When simulation is running there is easy way how to watch residual convergence process. gnuplot software is convenient for analyzing log file during the computation. Initial residuals can be plotted following way. Simple gnuplot script file:
set grid
set xlabel "iterations"
set ylabel "initial residuum"
set logscale y
set key box above

plot "< grep 'Solving for Ux' log | sed -n '4~4p' | cut -f 9 -d ' '" with lines title "u 4", \
     "< grep 'Solving for Ux' log | sed -n '3~4p' | cut -f 9 -d ' '" with lines title "u 3", \
     "< grep 'Solving for Ux' log | sed -n '2~4p' | cut -f 9 -d ' '" with lines title "u 2", \
     "< grep 'Solving for Ux' log | sed -n '1~4p' | cut -f 9 -d ' '" with lines title "u 1", \
     "< grep 'Solving for Uy' log | sed -n '4~4p' | cut -f 9 -d ' '" with lines title "v 4", \
     "< grep 'Solving for Uy' log | sed -n '3~4p' | cut -f 9 -d ' '" with lines title "v 3", \
     "< grep 'Solving for Uy' log | sed -n '2~4p' | cut -f 9 -d ' '" with lines title "v 2", \
     "< grep 'Solving for Uy' log | sed -n '1~4p' | cut -f 9 -d ' '" with lines title "v 1", \
     "< grep 'Solving for Uz' log | sed -n '4~4p' | cut -f 9 -d ' '" with lines title "w 4", \
     "< grep 'Solving for Uz' log | sed -n '3~4p' | cut -f 9 -d ' '" with lines title "w 3", \
     "< grep 'Solving for Uz' log | sed -n '2~4p' | cut -f 9 -d ' '" with lines title "w 2", \
     "< grep 'Solving for Uz' log | sed -n '1~4p' | cut -f 9 -d ' '" with lines title "w 1", \
     "< grep 'Solving for p' log | sed -n '4~4p' | cut -f 9 -d ' '" with lines title "p 4", \
     "< grep 'Solving for p' log | sed -n '3~4p' | cut -f 9 -d ' '" with lines title "p 3", \
     "< grep 'Solving for p' log | sed -n '2~4p' | cut -f 9 -d ' '" with lines title "p 2", \
     "< grep 'Solving for p' log | sed -n '1~4p' | cut -f 9 -d ' '" with lines title "p 1", \
     "< grep 'Solving for k' log | sed -n '4~4p' | cut -f 9 -d ' '" with lines title "k 4", \
     "< grep 'Solving for k' log | sed -n '3~4p' | cut -f 9 -d ' '" with lines title "k 3", \
     "< grep 'Solving for k' log | sed -n '2~4p' | cut -f 9 -d ' '" with lines title "k 2", \
     "< grep 'Solving for k' log | sed -n '1~4p' | cut -f 9 -d ' '" with lines title "k 1", \
     "< grep 'Solving for epsilon' log | sed -n '4~4p' | cut -f 9 -d ' '" with lines title "epsilon 4", \
     "< grep 'Solving for epsilon' log | sed -n '3~4p' | cut -f 9 -d ' '" with lines title "epsilon 3", \
     "< grep 'Solving for epsilon' log | sed -n '2~4p' | cut -f 9 -d ' '" with lines title "epsilon 2", \
     "< grep 'Solving for epsilon' log | sed -n '1~4p' | cut -f 9 -d ' '" with lines title "epsilon 1", \
     "< grep 'Solving for omega' log | sed -n '4~4p' | cut -f 9 -d ' '" with lines title "omega 4", \
     "< grep 'Solving for omega' log | sed -n '3~4p' | cut -f 9 -d ' '" with lines title "omega 3", \
     "< grep 'Solving for omega' log | sed -n '2~4p' | cut -f 9 -d ' '" with lines title "omega 2", \
     "< grep 'Solving for omega' log | sed -n '1~4p' | cut -f 9 -d ' '" with lines title "omega 1"


pause 10

#reread
#pause mouse
The residuum.gp script can be found in:
$WM_PROJECT_INST_DIR/waterTurbines-CFD-XX.XX/tutorials/kaplanTutorial/
and/or
$WM_PROJECT_INST_DIR/waterTurbines-CFD-XX.XX/tutorials/francisTutorial/
Run the gnuplot script:
# gnuplot residuum.gp

Figure: Water turbine CFD, convergence monitoring plot example.


