Previous: Aerodynamic coefficients and Up: Test case: motorBike Next: Rotation using OpenFOAM
This is an automatically generated documentation by LaTeX2HTML utility. In case of any issue, please, contact us at info@cfdsupport.com.
Function probe
- Function probe monitors values of selected quantities in selected points of computational domain
- Function probe is set in file controlDict
- Extend configuration file controlDict adding
#include "probe" - In directory system create file probe:
/*--------------------------------*- C++ -*----------------------------------*\ | ========= | | | \\ / F ield | OpenFOAM: The Open Source CFD Toolbox | | \\ / O peration | Version: dev | | \\ / A nd | Web: www.OpenFOAM.org | | \\/ M anipulation | | \*---------------------------------------------------------------------------*/ probes { // Where to load it from functionObjectLibs ( "libsampling.so" ); type probes; // Name of the directory for probe data name probes; // Fields to be probed fields ( p U ); probeLocations ( ( -0.085 0. 0.78 ) // at center of the motor bike mask ( 0.5 0. 1.351) // at top of the helmet ( 1.745 0. 1.01 ) // at tail of the motorbike ); } // ************************************************************************* // - probe function was added
- At selected locations (center of the mask, top point of the helmet and motorbike tail) we follow pressure and velocity components
- Data are saved in directory postProcessing/probes
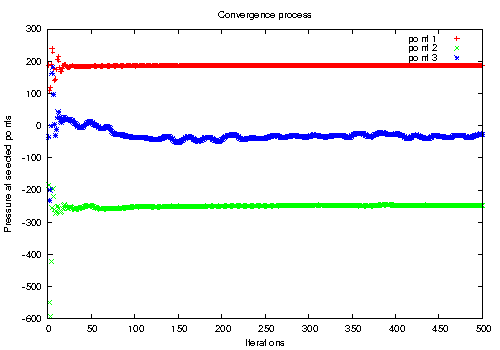
- Create easy Gnuplot script named e.g. plotProbes which displays pressure development in three selected points:
# Gnuplot script file for plotting data from file "probes.dat" set title "Convergence process" set xlabel "Iterations" set ylabel "Pressure at selected points" plot "postProcessing/probes/0/p" using 1:2 title 'point 1', \ "postProcessing/probes/0/p" using 1:3 title 'point 2', \ "postProcessing/probes/0/p" using 1:4 title 'point 3' pause mouse - Run the script:
# gnuplot plotProbes

Figure: OpenFOAM tutorial motor bike. Pressure distribution at three selected locations (1 – center of the mask, 2 – top point of helmet and 3 – motorbike tail)
Previous: Aerodynamic coefficients and Up: Test case: motorBike Next: Rotation using OpenFOAM


